


Your school website is only as effective as your users think it is. If parents complain that they can’t find what they are looking for, there’s a problem. We could claim user error—that they just don’t know what they are doing—but if there is a problem, it is our problem and we need to own it.
So, what can we do to make our website user-friendly for all? For starters, we can analyze our website. Google Analytics is a great tool designed to help us do so.
Knowing what pages and areas our website visitors frequent will help us understand their needs. Knowing that will help us to know how we can improve their experience on our website. It can also help us to get more site traffic, which can increase our enrollment and keep our existing customers happier. This is just a part of effective school website management.
Start with analysis: Google Analytics
One thing that Google does quite well is gather data about website traffic and the related statistics that will help businesses improve their conversion rates. This information will also help school administrators and school website managers improve their school website effectiveness. Google Analytics is a valuable tool, so learn how to use it to your advantage.
1. Setting up Google Analytics on your school website
Begin by adding some simple code to your website. This is free and easy to do. Just click on the instruction link and follow Google’s steps. You’ll add the code as indicated and then log in to your account.
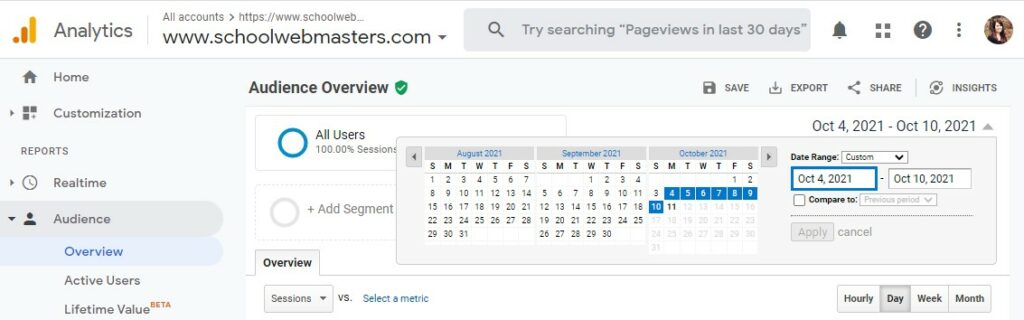
2. Selecting date range
You’ll need to select a date range in the upper right corner of your Google Analytics home page. This is self-explanatory, using the simple calendar selector or typing in the date range.
3. Tracking your website visitors
One of the most insightful aspects is understanding how your customers (prospective parents) are finding you. By checking out the acquisition area of your dashboard, you can see where your site traffic is coming from and make any necessary changes to improve that traffic. For example, if you have social media and want to increase traffic from those platforms, you can add more content to those channels and link to pages on your website like blog posts or news articles.
Here are a few of the various channels you can review in Google Analytics:
- Direct. This refers to the visits to your school website in which users navigated to your school’s website URL by typing the domain name into their URL/search bar, by clicking on a bookmark, by clicking on a link within an email (one that isn’t tagged with tracking parameters), or by clicking on a link in a text or mobile messaging app.
- Organic Search. This refers to the visitors that found you from an organic (unpaid) search. This should increase when you have a strong SEO strategy in place and is usually determined by organic traffic through such search engines as Google, Bing, DuckDuckGo, or Yahoo.
- Social. This refers to the visits you are receiving from various social platforms like Facebook, Twitter, Instagram, etc.
- Email. If your school is using an email campaign to increase enrollment (or to keep your current parents informed), the traffic from those tagged links that are clicked within those email messages show up here. You can Also add tracking links to the URLs in your emails using Google’s URL builder tool.
- Referral. This refers to traffic generated from a link to your website from another website (not including major search engines). For example, if you have links to your school websites posted on the city, county, or chamber of commerce websites, that traffic shows up here.
- Paid Search. Often referred to as pay-per-click (PPC) campaigns (i.e., Google AdWords) the results show up here. You can also link any AdWords campaigns you are using to your Google Analytics account for more detailed reporting under Acquisition.
- Other Traffic. This refers to traffic coming from online advertising (such as cost-per-view video advertising). Sometimes other undefined traffic may show up here, but over time it will filter out unwanted channels.
- Display. This refers to traffic from display advertising, like Google AdWords remarketing campaigns.
4. Finding your most visited pages (site content)
This is one of the most helpful areas for your analysis. You’ll find it under the “Behavior” in your Google Analytics. It is your site content tool. It not only shows the most popular pages (so you can make those pages easily accessible from your home page and in your mobile-friendly menu), but it also shows you what topics are of primary interest to your website visitors. You’ll want to be sure those pages are always current, accurate, and informative.
Download Our FREE eBook: How to Create an Exceptional School Website
Here are a few site content sub-sections you’ll want to review:
- All Pages. This shows a list of all the pages on your site (well, those viewed during the dates you specified in your report). These include Pageviews (how many times this page was viewed), Unique Pageviews (how many unique sessions for a page), Average Time on Page (the average time spent on the page), Entrances (how many times a page was the first page the user viewed as the entrance to your school’s website), Bounce Rate (percentage of visits in which a person leaves your website from the landing page without viewing other pages), % Exit (the Pageview percentage of the final page visit before a site visitor left your website), and Page Value (used for sites selling items online).
- Content Drilldown. Helps you see how well your site is organized and which information is most popular/useful. Clicking on the links will let you see a more detailed breakdown of the corresponding pages within the selected folder. This report shows you the pages and information that are valuable to your site visitors (or those of low interest). This information will help you highlight the most popular pages and remove those of no interest.
- Landing Pages. This information shows you a conversion rate and is essential to analyzing school marketing performance.
- Exit Pages. These are the final pages viewed within a visit. Use this information to monitor which pages could use improvement when you want to drive your users toward a contact page, an admissions page, or another conversion page.
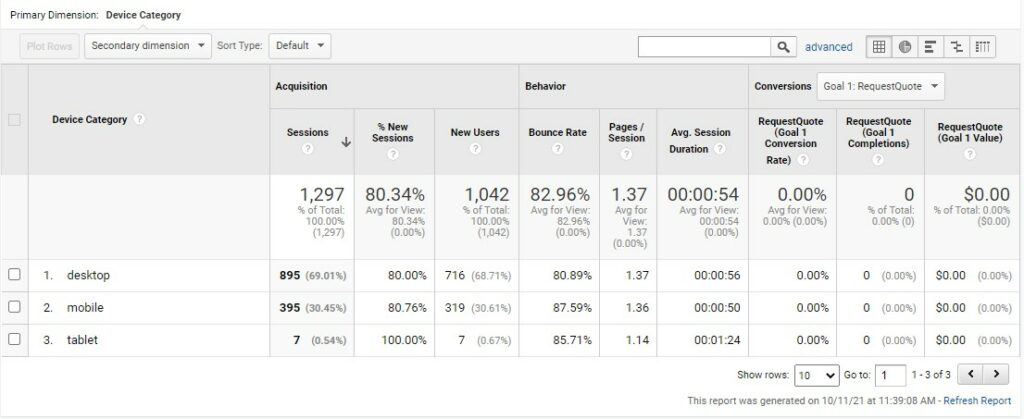
5. Learning how your visitors are accessing your website
Knowing what sort of device your website visitors are using to access your website helps you focus your efforts on improvements. Each device, whether a desktop, tablet, or smartphone requires distinctive design elements, so knowing this information is critical.
For example, each year more and more parents are using their smartphones to access websites, which means it is vital to improving your responsive website design. If the bounce rates vary significantly between your desktop and mobile visits, that might indicate that you need to take a hard look at the mobile version experience your users enjoy (or don’t enjoy, as the case may be).
Also, a well-designed mobile view can eliminate the need for a website app, creating an extremely satisfying experience for your website visitors (and your school). Since average app downloads and engagement are dismal at best, this is definitely worth considering from a customer-service perspective.
Know thyself
The more you know about your school website, the more useful it will be to your site visitors. Use Google’s free tool to help create a website that will work for you:
- Provide better school customer service by making the information that is most important to them easily available (and obvious).
- Save your staff time by eliminating avoidable phone calls to the office or to your staff.
- Create a brand image that says you care about your parents’ and students’ time by creating convenient, reliable access to school information.
Your school website can and should be your most effective customer service and marketing tool. It will be if you take the time to understand your school website’s strengths and weaknesses (enjoying the former and fixing the latter). Use Google Analytics to help understand what is working and what isn’t and to manage for ongoing improvement.
Melanie Guymon, COO, School Webmasters, LLC.